# モジュールのインポート
import cv2
import numpy as np
import matplotlib.pyplot as plt
from scipy.signal import find_peaks
from matplotlib.animation import FuncAnimation
入力画像
今回はキュウリ画像を例にその輪郭の曲率を計算してみました。
img = cv2.imread('cucumber.jpeg')
fig, ax = plt.subplots()
ax.imshow(img[:, :, ::-1]) # BGR -> RGB
plt.show()

二値化から輪郭抽出まで
まずは二値化し輪郭抽出を行います。一応モルフォロジー演算(Open, Close)をしていますが、結構輪郭がギザギザしていることがわかります。
# Lab色空間のbチャンネルを使ってニ値画像を作成
_, _, b = cv2.split(cv2.cvtColor(img, cv2.COLOR_BGR2Lab))
b = cv2.GaussianBlur(b, (5, 5), 10)
_, mask = cv2.threshold(b, 140, 255, cv2.THRESH_BINARY)

# モルフォロジー演算によるマスクの前処理
kernel = cv2.getStructuringElement(cv2.MORPH_ELLIPSE, (85, 85))
mask = cv2.morphologyEx(mask, cv2.MORPH_CLOSE, kernel, iterations=1)
mask = cv2.morphologyEx(mask, cv2.MORPH_OPEN, kernel, iterations=1)

# 輪郭抽出
contours, _ = cv2.findContours(mask, cv2.RETR_EXTERNAL, cv2.CHAIN_APPROX_NONE)
nbElt = 1024
# 等間隔にサンプリング
contour = cv2.ximgproc.contourSampling(contours[0], nbElt=nbElt)

# 輪郭の描画
def plot_contour(img, contour, ax):
    x, y = contour[:, 0, 0], contour[:, 0, 1]
    for a in ax:
        a.imshow(img[:, :, ::-1])
        a.plot(x, y)
    # top
    ax[1].set_xlim(600, 1300)
    ax[1].set_ylim(1200, 0)
    # middle
    ax[2].set_xlim(800, 1500)
    ax[2].set_ylim(2400, 1200)
    # bottom
    ax[3].set_xlim(800, 1500)
    ax[3].set_ylim(3600, 2400)

fig, ax = plt.subplots(1, 4, figsize=(9, 3))
plot_contour(img, contour, ax)
plt.tight_layout()
plt.show()

フーリエ変換による輪郭の平滑化
輪郭を周期関数と見て離散フーリエ変換をしたのち、高周波成分を0にして逆変換することで輪郭を平滑化します。nは使用する係数の数で少ないほど強い平滑化になります。
今回はn=20としました。
def smooth_fourier(contour, n):
    assert n > 0
    dft = cv2.dft(contour)
    dft[n+1:-n] = 0.0
    contour = cv2.idft(dft, flags=cv2.DFT_SCALE)
    contour = cv2.ximgproc.contourSampling(contour, nbElt=len(contour))
    return contour

fig, ax = plt.subplots(3, 4, figsize=(10, 10))
for i, n in enumerate([5, 20, 50]):
    contour_smoothed = smooth_fourier(contour, n)
    plot_contour(img, contour_smoothed, ax[i, :])
    for a in ax[i, :]:
        a.set_title(f'n={n}')
plt.show()

ガウシアンフィルタによる平滑化
一応、他の平滑化手法としてガウシアンフィルタも適用してみました。こちらはsigmaの値が大きいほど強い平滑化になります。
今回はsigma=8としました。
from scipy.ndimage import gaussian_filter1d

def smooth_gaussian(contour, sigma):
    assert sigma > 0
    x = contour[:, 0, 0]
    y = contour[:, 0, 1]
    x = gaussian_filter1d(x, sigma, mode='wrap')
    y = gaussian_filter1d(y, sigma, mode='wrap')
    contour = np.stack([x, y], axis=-1)
    contour = np.expand_dims(contour, 1)

    return contour

fig, ax = plt.subplots(3, 4, figsize=(10, 10))
for i, sigma in enumerate([16, 8, 1]):
    contour_smoothed = smooth_gaussian(contour, sigma)
    plot_contour(img, contour_smoothed, ax[i, :])
    for a in ax[i, :]:
        a.set_title(f'sigma={sigma}')
plt.show()

曲率の計算
いよいよ輪郭の曲率を計算します。輪郭を として媒介変数表示したとき、符号付き曲率は次のように定義されます。
https://en.wikipedia.org/wiki/Curvature より
def calc_curvature(points):
    n = len(points)
    x = points[:, 0, 0]
    y = points[:, 0, 1]

    # 境界部分の微分の安定化のため
    x = np.concatenate([x]*3)
    y = np.concatenate([y]*3)

    # 微分
    dx = np.gradient(x)
    dy = np.gradient(y)
    ddx = np.gradient(dx)
    ddy = np.gradient(dy)

    # 曲率
    curvature = (ddx * dy - dx * ddy) / (dx **2 + dy **2)**1.5
    return curvature[n:2*n]
オリジナルの輪郭と、平滑化された輪郭の曲率を計算してみます。オリジナルの輪郭に対する曲率はノイズだらけですが、平滑化することでなんとなくの傾向が見えてきました。
fig, ax = plt.subplots(figsize=(8, 4))

curvature = calc_curvature(contour)
ax.plot(np.roll(curvature, -100), label='original', alpha=0.5)

curvature = calc_curvature(smooth_fourier(contour, n=20))
ax.plot(np.roll(curvature, -100), label='fourier')

curvature = calc_curvature(smooth_gaussian(contour, sigma=8))
ax.plot(np.roll(curvature, -100), label='gaussian')

ax.legend()
plt.show()

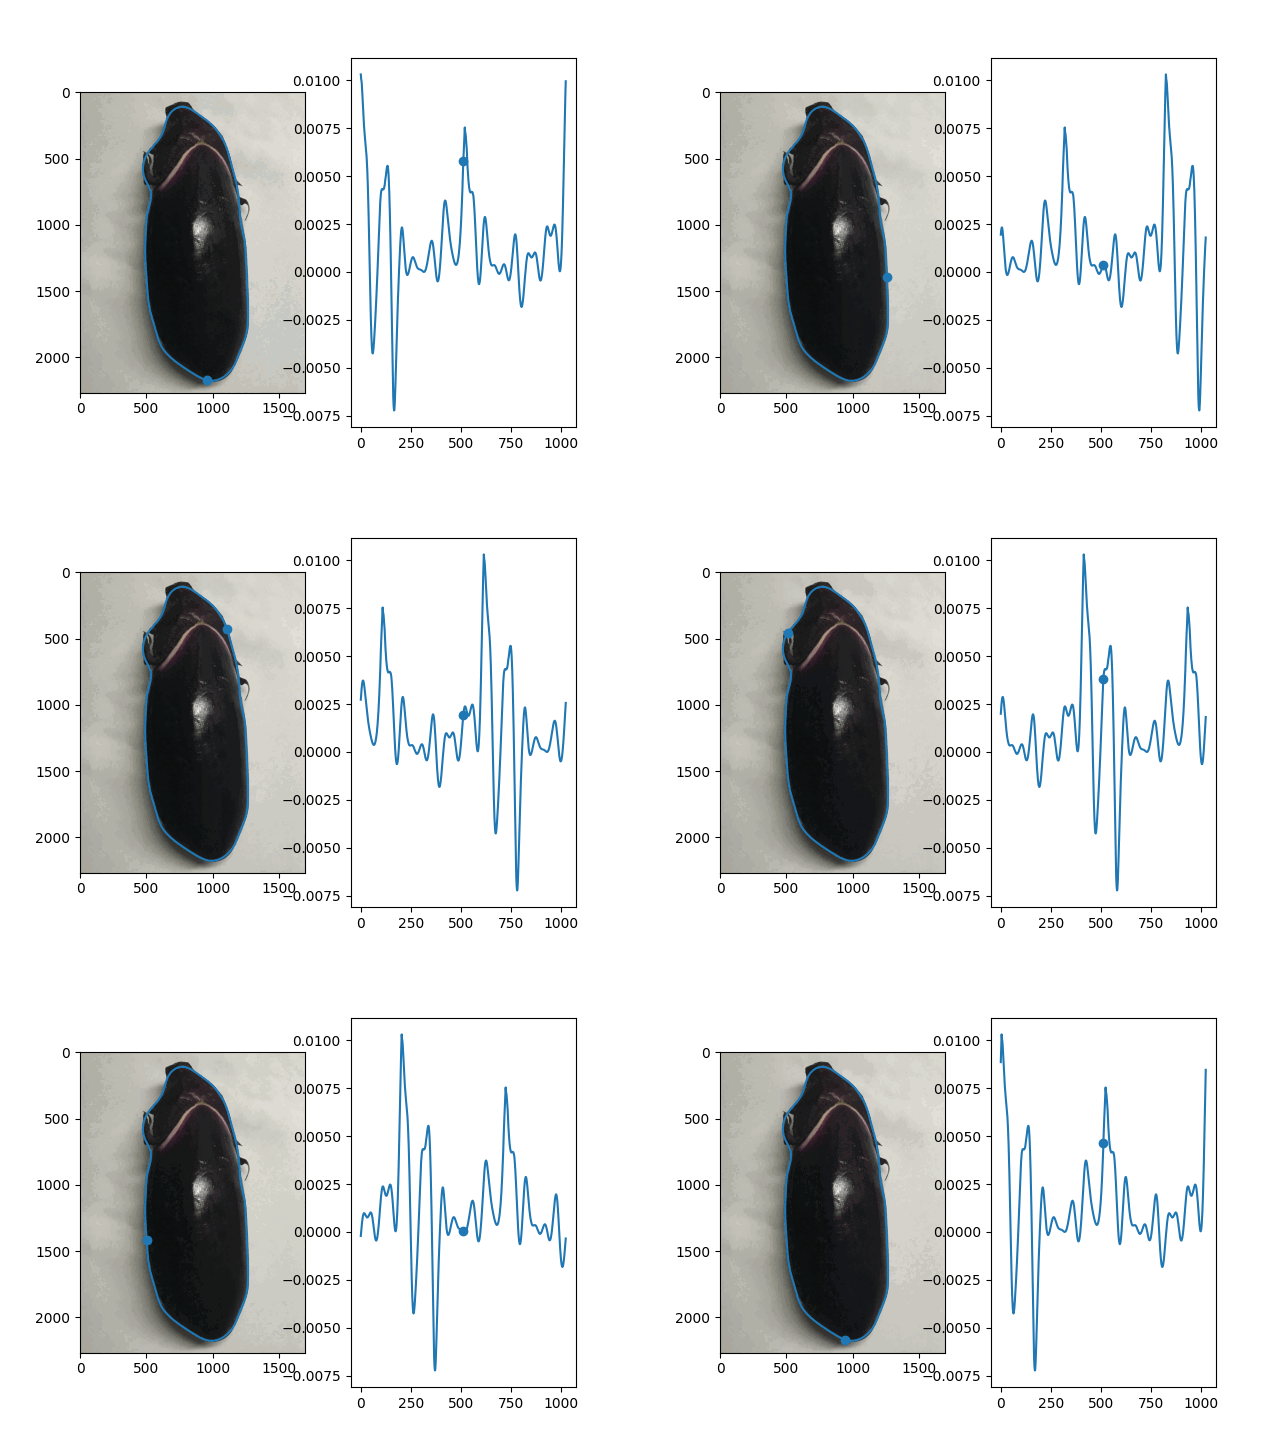
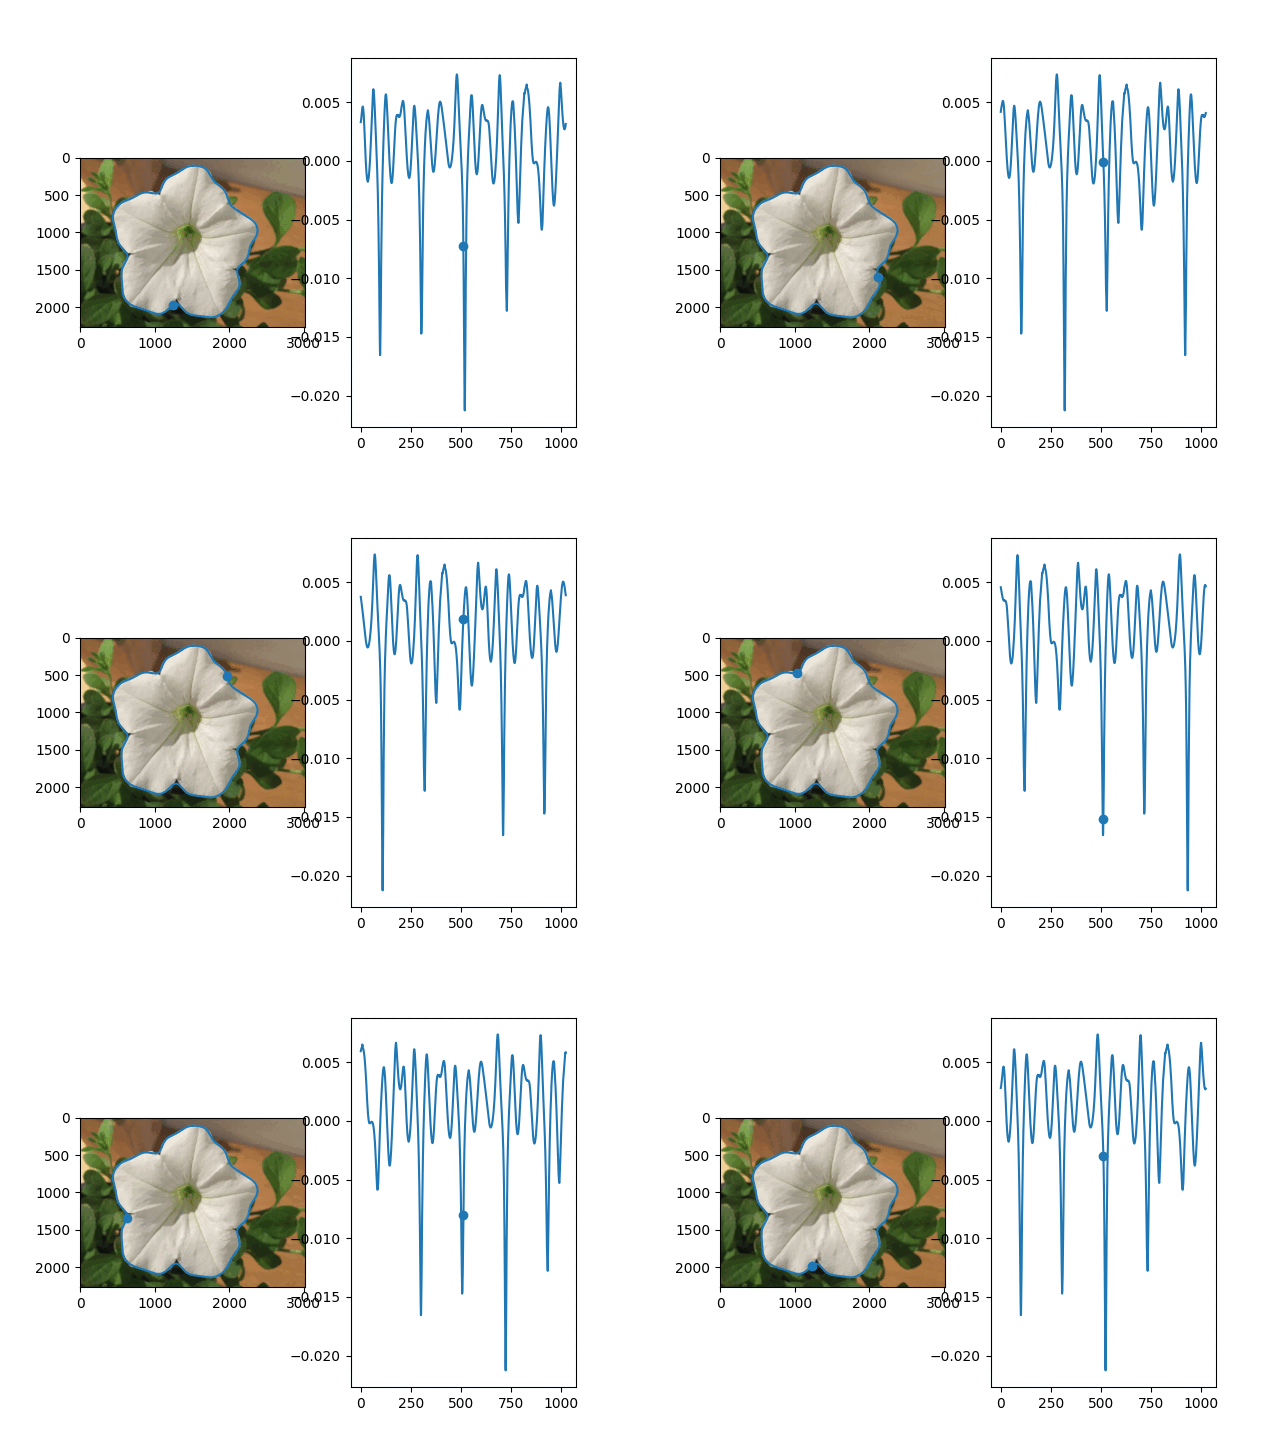
続いて輪郭の各位置と曲率の対応関係を可視化するため、動画として出力してみました。輪郭と曲率のグラフについて、それぞれ同じインデックスの点を動く点として表示しています。
def plot_curvature(img, contour, curvature):
    fig, (ax_ct, ax_cv) = plt.subplots(1, 2)

    # 入力画像と輪郭
    x, y = contour[:, 0, :].T
    ax_ct.imshow(img[:, :, ::-1])
    ax_ct.plot(x, y, 'tab:blue')

    n = len(contour)
    m = n // 2
    i = np.arange(n)
    # 輪郭上の動点
    point_ct, = ax_ct.plot(x[m], y[m], 'tab:blue', marker='o')
    # 曲率
    line_cv, = ax_cv.plot(i, curvature, 'tab:blue')
    # 曲率上の動点
    point_cv, = ax_cv.plot([m], [curvature[m]], 'tab:blue', marker='o')

    def update(frame):
        frame = frame
        rolled = np.roll(curvature, -frame)
        point_ct.set_data([x[(m+frame)%n]], [y[(m+frame)%n]])
        line_cv.set_data(i, rolled)
        point_cv.set_data([m], [rolled[m]])
        return point_ct, line_cv, point_cv,

    ani = FuncAnimation(fig, update, frames=range(0, n, 10), interval=5, blit=True)
    return ani
contour = smooth_fourier(contour, 20)
curvature = calc_curvature(contour)
ani = plot_curvature(img, contour, curvature)
ani.save('curvature.gif', writer='imagemagick', fps=10)

こう見ると曲率が極大を取るところはキュウリのヘタと先端部分であることがわかります。このことから、キュウリのヘタと先端部分を抽出し、プロットすることも可能となります。
def where_tip(contour):
    curvature = calc_curvature(contour)

    # 極大値が輪郭の配列先頭にあると極大として見えないのでずらす
    min_i = curvature.argmin()
    curvature_rolled = np.roll(curvature, -min_i)
    contour_rolled = np.roll(contour, -min_i, axis=0)

    peaks, _ = find_peaks(curvature_rolled)
    assert len(peaks) >= 2
    peaks = sorted(peaks, key=lambda p: curvature_rolled[p], reverse=True)[:2]

    # 曲率極大を示す輪郭位置の座標
    tips = contour_rolled[peaks]

    return tips

tip1, tip2 = where_tip(contour)

fig, ax = plt.subplots()
ax.imshow(img[:, :, ::-1])
ax.plot(contour[:, :, 0], contour[:, 0, 1])
ax.plot(tip1[0, 0], tip1[0, 1], 'r*')
ax.plot(tip2[0, 0], tip2[0, 1], 'c*')
plt.show()

その他の例
ナス

花

ニンジン

まとめ
今回は画像解析において、輪郭の特徴量の1つである曲率を計算してみました。曲率を計算することで、フェノタイピングや形状解析において有用な情報を得ることができるかもしれません。実際、いくつか論文で曲率を使用した形状解析が行われているようです。